
I track economic data releases the same way a pilot tracks weather: not because every indicator changes my course, but because ignoring the right one at the wrong moment has consequences. When the US Non-Farm Payrolls report dropped 250,000 jobs short of consensus in late 2024, USD/JPY moved 1.4% in four minutes. Traders who understood why — the Federal Reserve’s dual mandate, the yield differential with Japan — navigated it. Those who didn’t got stopped out.
This guide explains what trading economics is, how the Trading Economics platform works, and which indicators actually matter for active traders. If you’re new to macroeconomic analysis, start at the top. If you already trade fundamentals, skip to the indicator priority framework.
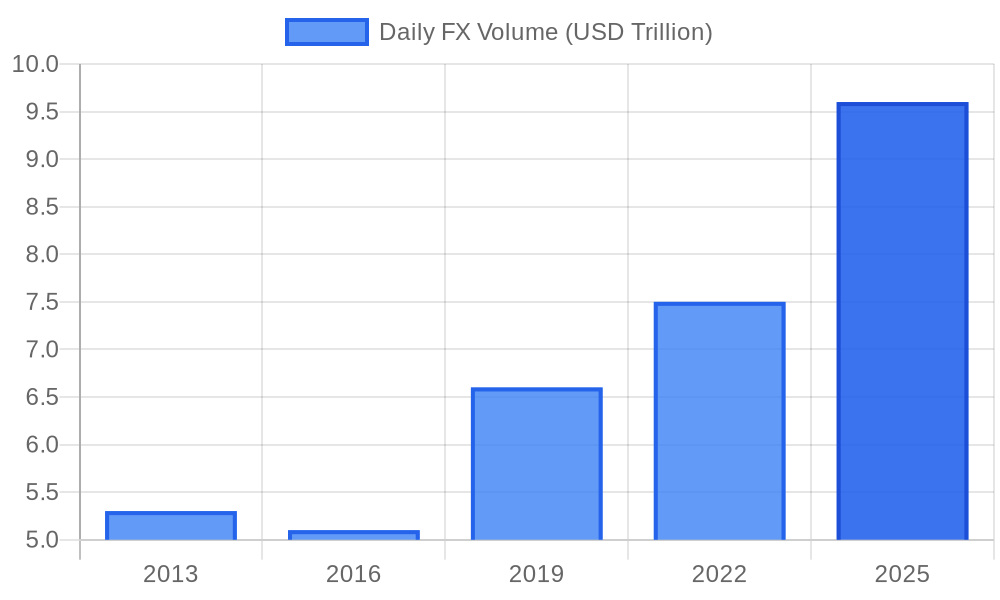
Trading Economics aggregates over 20 million economic indicators from 196 countries, including GDP, CPI, interest rates, and PMI data. The global FX market trades $9.6 trillion per day (BIS Triennial Survey, 2025). Understanding economic data releases — when they publish, what they measure, and how far actuals deviate from consensus — is one of the most repeatable edges available to retail traders.
What Is Trading Economics?
Trading economics is the study of how macroeconomic variables — GDP growth, inflation, employment, trade balances, and central bank policy — influence financial markets. Every major asset class responds to economic data: currencies move on interest rate differentials, equities reprice on earnings expectations driven by GDP, and commodities react to demand forecasts tied to industrial output.
The discipline bridges academic economics and practical market analysis. A trading economist doesn’t just understand what CPI measures — they understand that a 0.3% monthly CPI surprise above consensus historically produces a specific pattern in EUR/USD within the first 15 minutes of the release. The mechanism matters as much as the metric.
Trading Economics (tradingeconomics.com) is also the name of a widely-used data platform that aggregates economic indicators across 196 countries. Founded in 2010, it provides historical data, real-time forecasts, and economic calendars used by institutional and retail traders. The platform indexes over 20 million indicators, updated at release frequency — some daily, some quarterly.
The two concepts — trading economics as a discipline and Trading Economics as a platform — overlap significantly. The platform is, in effect, an applied tool for practising the discipline. Understanding one without the other leaves gaps.
Citation capsule: Trading Economics covers 20M+ indicators across 196 countries. The global FX market — the most economically sensitive major market — trades $9.6 trillion per day, per the BIS 2025 Triennial Survey. Economic data releases are the primary catalyst for intraday volatility spikes in FX, fixed income, and commodity markets. (BIS, 2025)
The Trading Economics Platform: Data, Tools, and Access
The Trading Economics platform organises macroeconomic data into four functional layers that traders use differently depending on their workflow.
Economic Calendar
The calendar is the most used feature for active traders. It lists upcoming data releases — NFP, CPI, central bank decisions, trade balance, retail sales — by country, date, time, and expected impact. Each entry shows the prior reading, consensus forecast, and (after release) the actual figure.
The consensus figure is critical. Markets price expected data in advance. The deviation between forecast and actual — not the absolute number — drives the immediate price move. A GDP reading of 2.1% is bullish if consensus was 1.8%, and bearish if consensus was 2.4%. The calendar makes this visible in real time.
Free tier access: The calendar is free for the current month. Historical calendar data and API access require a paid subscription.
Indicators Database
The indicators database covers categories including:
- Monetary policy: interest rates, central bank balance sheets, money supply (M1, M2, M3)
- Growth: GDP (quarterly, annual), industrial production, manufacturing output
- Inflation: CPI, PPI, PCE (for the US), core inflation excluding food and energy
- Labour market: unemployment rate, NFP (US), claimant count (UK), participation rate
- Trade: current account balance, trade deficit/surplus, export/import volumes
- Consumer: retail sales, consumer confidence indices (Conference Board, University of Michigan)
- Business: PMI (manufacturing and services), ISM, business confidence
For each indicator, the platform shows historical data going back decades, with chart tools for trend analysis. This is where traders build the macroeconomic baseline — understanding where an economy is in its cycle before positioning around near-term releases.
Country Profiles and Forecasts
Each country page aggregates all major indicators into a single dashboard with Trading Economics’ proprietary forecasts. These forecasts use a combination of historical trend analysis and econometric modelling. They’re directionally useful for swing traders and medium-term position traders but should not be treated as precise point estimates.
API and Data Exports
Institutional users and quantitative traders access data via API (JSON format) or bulk CSV exports. The API covers all indicators at their native release frequency, making it viable for algorithmic trading strategies that trigger on data deviations. API access is subscription-only; plans vary by country coverage and data granularity.
What Are Leading and Lagging Economic Indicators?
Economic indicators are classified by their timing relationship to the business cycle. This classification determines how traders use them — for anticipating moves versus confirming trends.
Leading Indicators
Leading indicators change before the economy shifts direction — they signal turning points in advance. For traders, these are the highest-value data points because they allow positioning ahead of the move.
Key leading indicators:
- Purchasing Managers’ Index (PMI): Monthly survey of procurement managers. A reading above 50 signals expansion; below 50 signals contraction. PMI tends to lead GDP by one to two quarters.
- Yield curve: The spread between 10-year and 2-year Treasury yields. An inverted curve (short rates above long rates) has preceded every US recession since 1955, typically by 12-18 months.
- Housing starts and building permits: Construction activity leads economic output. New home permits lead starts by one month; starts lead GDP by two to four quarters.
- Consumer confidence: The Conference Board’s Consumer Confidence Index and University of Michigan Sentiment Index signal future spending six to twelve months out.
Coincident Indicators
These move in tandem with the current state of the economy — confirming rather than predicting.
- GDP: The broadest measure of economic output. Quarterly releases confirm what PMI and leading indicators signalled months earlier.
- Non-Farm Payrolls (NFP): Monthly US employment. A coincident indicator for the labour market, though its size and market sensitivity make it a tier-one trading event.
- Industrial production: Monthly output from manufacturers, miners, and utilities. Tracks current economic activity closely.
Lagging Indicators
Lagging indicators confirm trends that are already established. They’re less useful for entry timing but valuable for assessing cycle duration and positioning conviction.
- CPI (Consumer Price Index): Inflation tends to peak after economic activity peaks, as price pressures build up over time.
- Unemployment rate: The labour market lags the economy — companies stop hiring (and start firing) after the downturn is underway.
- Trade balance: Export/import data reflects activity from prior months due to shipping and reporting lags.
For traders: Prioritise leading indicators for position entry, coincident indicators for sizing conviction, and lagging indicators for confirming cycle phase — not for timing entries.
Which Economic Indicators Move Markets the Most?
Not all data releases move markets equally. The indicators that consistently produce the sharpest, most sustained price moves share three characteristics: large sample size, direct central bank relevance, and near-universal market attention.
Tier 1: Consistent High-Impact Events
Non-Farm Payrolls (US, monthly): The single most market-moving regular data release globally. NFP measures net new jobs added to the US economy, excluding farm workers. A significant miss or beat against consensus — typically anything beyond ±75,000 from forecast — can produce 80-150 pip moves in EUR/USD within the first hour. The Federal Reserve’s dual mandate (price stability and maximum employment) means employment data directly informs rate expectations.
CPI (US, monthly): Consumer price inflation is the primary input into Federal Reserve rate decisions. The December 2025 FOMC meeting confirmed CPI at 2.7% YoY — still above the 2% target — keeping rate cut expectations subdued for Q1 2026. (Federal Reserve, December 2025)
Central bank rate decisions: Federal Reserve, ECB, Bank of England, Bank of Japan — rate decisions with accompanying statements and press conferences. These events are known in advance; markets price probabilities via interest rate futures. The surprise element lies in the language (hawkish vs dovish phrasing) and dot-plot projections, not just the rate itself.
GDP (quarterly): Advance, preliminary, and final readings of quarterly GDP. The advance reading (released approximately 30 days after quarter end) carries the most market impact.
Tier 2: Significant but Context-Dependent
PMI (monthly): Manufacturing and services PMI from Markit/S&P Global and ISM (for the US). High impact when readings cross the 50 threshold or deviate significantly from the prior trend.
Retail sales (monthly): Consumer spending accounts for approximately 70% of US GDP. A weak retail sales reading undermines GDP growth forecasts and can shift rate expectations.
Trade balance: Less consistent impact than employment or inflation data, but significant during periods of trade policy focus. Dollar-yen positioning is frequently influenced by Japan’s trade surplus data.
Housing data: Existing home sales, housing starts, and building permits. Sensitive market areas in the UK and Australia where housing is a dominant driver of household wealth and consumption.
Tier 3: Sector-Specific or Regional
Regional Fed surveys (Empire State, Philly Fed), ADP employment change (precursor to NFP), PPI, durable goods orders — these matter in context but rarely produce sustained directional moves in major currency pairs without confirmation from Tier 1 data.
The platform utility: The Trading Economics economic calendar codes releases by impact level (low, medium, high). For systematic traders, filtering for high-impact events and tracking deviation history gives a workable first screen for release selection.
How Do Traders Use Economic Data Releases?
There are three primary strategies for trading around economic data, each with distinct risk/reward profiles and position management requirements.
Strategy 1: Pre-Release Positioning (Directional Bias)
Traders analyse the trend in economic data to form a directional view before the release. If CPI has come in above consensus three months running, and the current consensus looks underestimated, a trader might establish a long USD position ahead of the release — anticipating a hawkish Fed reaction.
This approach requires understanding the full macro context: where the economy is in the cycle, what the central bank has signalled, and how the market is currently positioned. Position sizing must account for the risk that consensus was right (or that the market had already priced the move).
Risk: If the actual matches consensus exactly, the pre-positioned trade typically loses ground to spread and overnight funding — sometimes a significant cost.
Strategy 2: Post-Release Reaction (Momentum Entry)
Wait for the release, measure the deviation from consensus, and enter in the direction of the surprise. The first 60-90 seconds of a major release are often chaotic — spreads widen sharply, order flow is volatile. More structured entries emerge in the 90-second to 5-minute window once the initial spike resolves.
The historical pattern for a significant NFP beat:
- USD strengthens immediately (first 60 seconds)
- Pullback or consolidation (60-300 seconds)
- Continuation if the move is sustained by follow-through buying (5-30 minutes)
The continuation phase is where post-release momentum traders look for entries with defined risk against the release-candle low.
Strategy 3: Economic Context for Swing/Position Trading
Longer-term traders use economic data to frame macro themes rather than to trade individual releases. A trader who identified that the ECB would lag the Federal Reserve in cutting rates in 2025 built a long USD/EUR thesis — expressed across weeks or months, using individual data releases as confirmation points rather than entry triggers.
This approach relies heavily on the Trading Economics indicators database and country profiles. Comparing GDP trajectories, inflation differentials, and central bank forward guidance across two economies provides the framework for expressing currency views with duration.
See how to use a forex demo account to practise economic data trading without capital risk.
What Are the Risks of Trading Based on Economic Data? {#risks-of-trading-economic-data}
Economic data trading carries specific risks that differ from technical analysis-driven approaches. Traders who ignore these risks consistently give back any edge the fundamental analysis provides.
1. Revision risk. Initial economic data releases are frequently revised in subsequent months. A GDP reading that appeared contractionary on first release may be revised upward 60 days later. Trading the initial print as definitive is a structural error. The market, however, reacts to the initial release — the revision rarely produces an equivalent move.
2. Consensus mispricing. Economic forecasting is imprecise. Consensus estimates can be systematically wrong in one direction for extended periods, particularly around structural shifts (post-pandemic labour market, supply chain normalisation). A data-dependent approach requires checking whether the consensus itself is credible.
3. Spread and slippage during high-impact events. Liquidity evaporates around major data releases. Spreads that are normally 0.8 pips on EUR/USD can widen to 5-15 pips in the seconds before and after NFP. Market orders at these moments execute at prices that bear no relation to pre-release entry plans. Limit orders may not fill.
4. False breakouts. The initial price spike on a data release frequently reverses before establishing a directional trend. Trading the first candle off a major release is one of the highest false-breakout environments in FX.
5. Macro crowding. When a macro theme is widely held — everyone short JPY on the US-Japan rate differential in 2023-2024, for instance — the trade becomes vulnerable to sharp reversals when the thesis is challenged, because unwinding happens simultaneously across many participants.
6. Model risk. Economic data platforms, including Trading Economics, provide forecasts generated by econometric models. These models have structural assumptions that may not hold in novel economic environments. Treat platform forecasts as one input, not as a predictive guarantee.
Risk disclosure: Trading economic data releases involves substantial risk of loss, including loss of funds in excess of your initial deposit on leveraged products. Economic data is subject to revision. Past correlations between data releases and market moves are not predictive of future outcomes. This content is educational and does not constitute investment advice. Verify regulatory compliance with your broker before trading.
The Deloitte Global Economic Outlook 2026 projects global GDP growth of 1.9% for 2026, down from 2.4% in 2025, with elevated uncertainty from trade policy and geopolitical fragmentation. Slower growth reduces earnings visibility across equity markets and tightens the range of macro outcomes for currency positioning. (Deloitte, 2026)
The Bottom Line on Trading Economics
Trading economics — the discipline — gives traders a framework for understanding why markets move, not just when. The combination of leading indicator analysis, release-day trading tactics, and macro context positions traders ahead of the information curve rather than behind it.
The Trading Economics platform is the most accessible institutional-grade tool for this work at the retail level. The economic calendar alone — properly used, filtering for high-impact releases and tracking deviation history — is worth the learning curve for any trader who holds positions over news events.
The fundamentals aren’t a replacement for risk management. Knowing that NFP is likely to beat consensus doesn’t eliminate the risk of a 150-pip spike against you in the first 30 seconds of the release. Economic analysis informs the direction; position sizing, stop placement, and spread awareness determine whether you’re around to benefit from being right.
For further grounding in the forex market and how macroeconomic factors interact with currency pairs, the forex education centre covers everything from platform selection to advanced trading strategies.
Frequently Asked Questions
What is the Trading Economics platform used for?
Trading Economics is a data platform aggregating over 20 million economic indicators from 196 countries. Traders use it for the economic calendar — to track upcoming data releases and consensus forecasts — the indicators database to analyse historical macro trends, and country profiles to compare economic trajectories across markets. Free calendar access is available; historical data and API access require a paid subscription.
Which economic indicators should forex traders prioritise?
Tier 1 indicators: Non-Farm Payrolls (US), CPI (US and Eurozone), central bank rate decisions (Fed, ECB, BoE, BoJ), and advance GDP readings. These consistently produce the sharpest and most sustained moves in major currency pairs. Filter your economic calendar to high-impact events first, then track deviation history to understand which releases have a pattern of surprising consensus.
What is the difference between a forecast and an actual in economic data?
The forecast (consensus) is the median estimate from economists surveyed before a release. The actual is the reported figure when the data publishes. Markets price the consensus in advance — it’s the deviation between forecast and actual that drives the immediate price reaction. A GDP reading of 2.1% is bullish if consensus was 1.8%, and bearish if consensus was 2.4%. The absolute number matters less than the surprise.
Why does the unemployment rate lag behind the economy?
Unemployment is a lagging indicator because companies reduce hours and freeze hiring before they cut headcount. By the time layoffs appear in the unemployment rate, the economic slowdown is typically already several months old. This is why traders watch leading indicators like PMI and yield curve inversion as early warning signals, rather than waiting for unemployment to confirm the trend.
Is Trading Economics free to use?
The economic calendar for the current month is free. Basic country indicator pages with recent data are also free. Historical data beyond a rolling window, API access, bulk data exports, and premium forecasting tools require a paid subscription. For most retail traders, the free tier provides enough data to follow major releases and understand current economic conditions without a subscription.
This article is for educational purposes only and does not constitute financial or investment advice.